
Introduction
The Bill Williams Indicator, developed by legendary trader Bill Williams, is a powerful tool utilized by traders worldwide to identify trends, anticipate reversals, and make informed trading decisions. This article serves as a comprehensive guide to understanding and effectively utilizing the Bill Williams Indicator in various trading strategies.
What is Bill Williams Indicator?
The Bill Williams Indicator consists of a set of technical analysis tools designed to assess market dynamics and price action. It comprises several components, including the Alligator Indicator, Fractals, and the Awesome Oscillator, each offering unique insights into market trends and momentum. Bill Williams developed these indicators based on his Chaos Theory, which emphasizes the importance of market psychology and the interplay between chaos and order in financial markets.
How does the Alligator Indicator Work?
d potential trading opportunities in the direction of the trend.
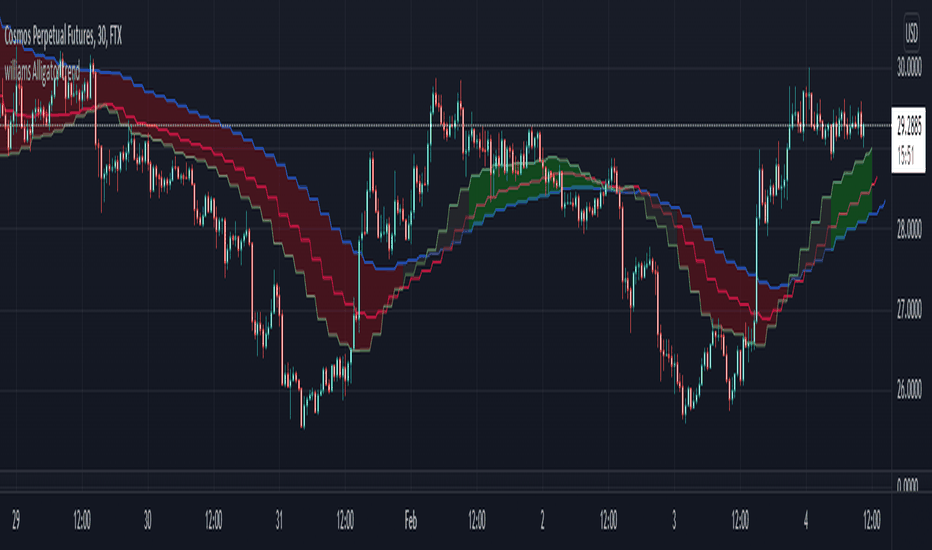
The Alligator Indicator operates based on the concept of “sleeping” and “awakening” phases of the market, as described by Bill Williams. Each of the three moving averages representing the Alligator’s jaws, teeth, and lips plays a specific role in identifying these phases and signaling potential trading opportunities.
- The Jaw (blue line): This line represents the 13-period smoothed moving average and serves as the slowest-moving component of the Alligator Indicator. It reflects the market’s “sleeping” phase, indicating a period of consolidation or sideways movement where price action lacks clear direction. When the Jaw is above the price action, it suggests a bearish bias, signaling potential downward pressure. Conversely, when the Jaw is below the price action, it indicates a bullish bias, suggesting potential upward momentum.
- The Teeth (red line): Representing the 8-period smoothed moving average, the Teeth line reflects the “awakening” phase of the market. As the intermediate moving average, it provides early signs of potential trend developments. When the Teeth line crosses above the Jaw, it signals the beginning of an uptrend, with bullish momentum gaining strength. Conversely, when the Teeth line crosses below the Jaw, it indicates the start of a downtrend, with bearish momentum increasing.
- The Lips (green line): This line represents the 5-period smoothed moving average and signifies the fastest-moving component of the Alligator Indicator. The Lips line confirms the direction of the trend identified by the Teeth and Jaw lines. When the Lips line crosses above the other two lines, forming a bullish alignment (Jaw at the bottom, followed by Teeth, then Lips), it confirms an uptrend. Conversely, when the Lips line crosses below the Jaw and Teeth lines, forming a bearish alignment, it confirms a downtrend.
In summary, the Alligator Indicator’s three lines work together to identify periods of consolidation and trends in the market. By observing the alignment and positioning of these lines, traders can gauge the strength and direction of the prevailing trend and make informed trading decisions accordingly. The Alligator Indicator serves as a valuable tool for traders seeking to capitalize on trending markets while avoiding false signals during periods of consolidation.
Alligator Indicator Calculation Formula
The Alligator Indicator lines are calculated using the following formulas:
- Jaw (blue line):
- Formula: Smoothed Moving Average (SMA) [(High + Low) / 2], shifted 8 bars into the future.
- Explanation: The Jaw line represents the 13-period smoothed moving average of the midpoint between the highest and lowest prices. This moving average is then shifted 8 bars into the future to provide a predictive element to the indicator.
- Teeth (red line):
- Formula: Smoothed Moving Average (SMA) [(High + Low) / 2], shifted 5 bars into the future.
- Explanation: Similar to the Jaw line, the Teeth line represents the 8-period smoothed moving average of the midpoint between the highest and lowest prices. This moving average is shifted 5 bars into the future to provide a shorter-term perspective compared to the Jaw line.
- Lips (green line):
- Formula: Smoothed Moving Average (SMA) [(High + Low) / 2], shifted 3 bars into the future.
- Explanation: The Lips line represents the 5-period smoothed moving average of the midpoint between the highest and lowest prices. This moving average is shifted 3 bars into the future, offering the shortest-term perspective among the three lines.
These formulas utilize the smoothed moving average calculation, which reduces noise and provides a smoother representation of price action. By averaging the highest and lowest prices over a specified period and shifting the resulting moving averages into the future, the Alligator Indicator aims to identify potential trends and reversals in the market with improved accuracy.
Understanding the principles behind the Bill Williams Indicator
The Bill Williams Indicator is grounded in several fundamental principles, each contributing to its effectiveness in analyzing market dynamics and guiding trading decisions:
- Market Psychology:
- The Bill Williams Indicator integrates insights from behavioral finance and market psychology, acknowledging the significant impact of emotions on traders’ decision-making processes.
- By understanding the role of fear, greed, and herd mentality in driving market trends, traders can better interpret the signals generated by the indicator and anticipate potential shifts in market sentiment.
- Chaos Theory:
- Bill Williams’ Chaos Theory forms a central tenet of the Bill Williams Indicator, emphasizing the presence of order within seemingly chaotic market movements.
- Chaos Theory posits that market fluctuations exhibit predictable patterns and trends, which traders can leverage to identify profitable trading opportunities amidst market volatility.
- By recognizing the underlying order within market dynamics, traders can apply the principles of Chaos Theory to discern patterns, trends, and potential reversals, enhancing their trading effectiveness.
- Fractals:
- Fractals serve as a key component of the Bill Williams Indicator, aiding in the identification of critical support and resistance levels.
- Fractals highlight recurring patterns of price reversal, indicating areas where market direction may undergo a significant change.
- By identifying fractal patterns on price charts, traders can anticipate potential turning points in the market and adjust their trading strategies accordingly.
- Momentum:
- The Awesome Oscillator, another component of the Bill Williams Indicator, measures the momentum of price movements by comparing the 34-period and 5-period simple moving averages.
- Momentum analysis helps traders gauge the strength and direction of market trends, providing valuable insights into potential entry and exit points.
- By monitoring changes in momentum, traders can confirm trend signals generated by other components of the Bill Williams Indicator and fine-tune their trading decisions for optimal profitability.
These principles collectively underpin the Bill Williams Indicator, empowering traders to interpret market dynamics with greater precision and make informed trading decisions. By integrating insights from market psychology, Chaos Theory, fractals, and momentum analysis, traders can leverage the full potential of the Bill Williams Indicator to navigate the complexities of the financial markets and achieve their trading objectives.
How to interpret the signals of the Bill Williams Indicator
Interpreting the signals of the Bill Williams Indicator involves analyzing the convergence and divergence of its components, particularly the Alligator Indicator lines. Key signals include:
Interpreting the signals of the Bill Williams Indicator is crucial for making informed trading decisions. Here’s how traders can interpret the signals effectively:
- Trend Confirmation:
- When the Alligator Indicator lines (Jaw, Teeth, Lips) are aligned and diverging, it confirms the presence of a trend in the market.
- Traders should observe the alignment of the lines, with the Lips leading the way, indicating the direction of the trend.
- For example, if the Jaw is below the Teeth, and the Teeth is below the Lips, forming a bullish alignment, it suggests an uptrend. Conversely, if the Jaw is above the Teeth, and the Teeth is above the Lips, forming a bearish alignment, it indicates a downtrend.
- Traders may consider entering trades in the direction of the trend, leveraging the momentum identified by the Alligator Indicator.
- Trend Reversal:
- A crossover or convergence of the Alligator Indicator lines suggests a potential trend reversal.
- Traders should pay close attention to the positioning of the lines and their interactions.
- For example, if the Lips crosses above or below the other two lines, it may signal a potential reversal in the current trend.
- Traders may exit existing positions or consider reversing their trades based on the direction of the crossover, adjusting their strategies to align with the emerging trend.
- Momentum Confirmation:
- The Awesome Oscillator, another component of the Bill Williams Indicator, provides insights into market momentum.
- Positive values on the Awesome Oscillator indicate bullish momentum, while negative values suggest bearish momentum.
- Traders should monitor divergence or convergence between price and the Awesome Oscillator to confirm potential trend changes.
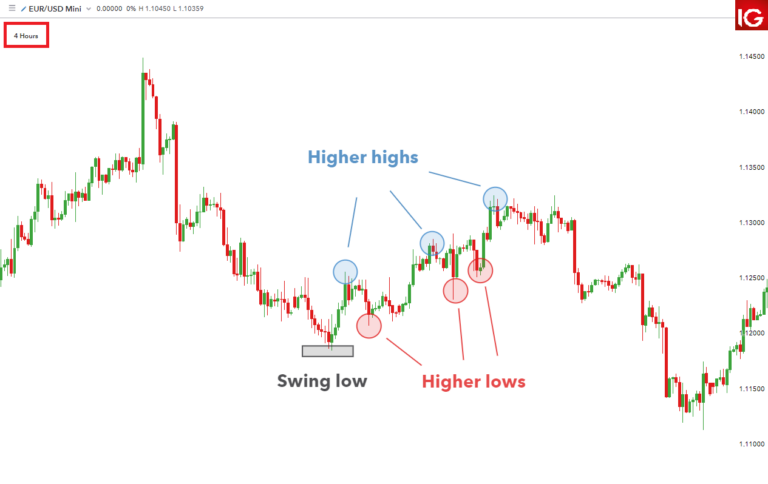
- For example, if the price is making higher highs while the Awesome Oscillator is making lower highs, it may signal weakening bullish momentum and a potential trend reversal.
- Traders can use these momentum signals to validate trend confirmations and anticipate potential shifts in market direction.
By analyzing the convergence and divergence of the Alligator Indicator lines and incorporating insights from the Awesome Oscillator, traders can interpret signals effectively and make informed trading decisions. It’s essential to combine these signals with other technical analysis tools and consider broader market factors to enhance the accuracy of trading strategies and achieve consistent profitability in the financial markets.
Applying the Bill Williams Indicator in different trading strategies
The Bill Williams Indicator can be applied in various trading strategies, including:
- Trend Following: Traders can use the Alligator Indicator to identify trends and enter trades in the direction of the prevailing trend. By aligning their trades with the dominant market direction, traders aim to capture profits as prices continue to move in their favor.
- Trend Reversal: The Bill Williams Indicator can help traders identify potential trend reversals by monitoring the convergence or crossover of its components. Traders may exit existing positions or enter reversal trades based on the signals provided by the indicator.
- Breakout Trading: Traders can utilize the Fractals component of the Bill Williams Indicator to identify key support and resistance levels. Breakouts above resistance or below support levels identified by Fractals may signal potential trading opportunities.
Tips for using the Bill Williams Indicator effectively
Interpreting the signals of the Bill Williams Indicator is crucial for making informed trading decisions. Here’s how traders can interpret the signals effectively:
- Trend Confirmation:
- When the Alligator Indicator lines (Jaw, Teeth, Lips) are aligned and diverging, it confirms the presence of a trend in the market.
- Traders should observe the alignment of the lines, with the Lips leading the way, indicating the direction of the trend.
- For example, if the Jaw is below the Teeth, and the Teeth is below the Lips, forming a bullish alignment, it suggests an uptrend. Conversely, if the Jaw is above the Teeth, and the Teeth is above the Lips, forming a bearish alignment, it indicates a downtrend.
- Traders may consider entering trades in the direction of the trend, leveraging the momentum identified by the Alligator Indicator.
- Trend Reversal:
- A crossover or convergence of the Alligator Indicator lines suggests a potential trend reversal.
- Traders should pay close attention to the positioning of the lines and their interactions.
- For example, if the Lips crosses above or below the other two lines, it may signal a potential reversal in the current trend.
- Traders may exit existing positions or consider reversing their trades based on the direction of the crossover, adjusting their strategies to align with the emerging trend.
- Momentum Confirmation:
- The Awesome Oscillator, another component of the Bill Williams Indicator, provides insights into market momentum.
- Positive values on the Awesome Oscillator indicate bullish momentum, while negative values suggest bearish momentum.
- Traders should monitor divergence or convergence between price and the Awesome Oscillator to confirm potential trend changes.
- For example, if the price is making higher highs while the Awesome Oscillator is making lower highs, it may signal weakening bullish momentum and a potential trend reversal.
- Traders can use these momentum signals to validate trend confirmations and anticipate potential shifts in market direction.
By analyzing the convergence and divergence of the Alligator Indicator lines and incorporating insights from the Awesome Oscillator, traders can interpret signals effectively and make informed trading decisions. It’s essential to combine these signals with other technical analysis tools and consider broader market factors to enhance the accuracy of trading strategies and achieve consistent profitability in the financial markets.
Case studies showcasing the success of the Bill Williams Indicator
To illustrate the effectiveness of the Bill Williams Indicator, let’s consider two hypothetical case studies:
Case Study 1: Trend Following
- Scenario: The Alligator Indicator lines (Jaw, Teeth, Lips) align in an upward direction, indicating a bullish trend.
- Action: A trader enters a long position based on the trend confirmation signal provided by the Alligator Indicator.
- Result: The price continues to trend upwards, allowing the trader to capture profits as the trend unfolds.
Case Study 2: Trend Reversal
- Scenario: The Alligator Indicator lines converge and crossover in a downward direction, signaling a potential trend reversal.
- Action: A trader exits existing long positions or enters short positions based on the trend reversal signal provided by the Alligator Indicator.
- Result: The price reverses direction, validating the trend reversal signal and allowing the trader to profit from the downward movement.
These case studies highlight the versatility of the Bill Williams Indicator in identifying both trend-following and trend-reversal opportunities, showcasing its effectiveness in various market conditions.
Common mistakes to avoid when using the Bill Williams Indicator
While the Bill Williams Indicator can be a valuable tool for traders, it’s essential to avoid common mistakes that may compromise trading performance:
- Overlooking Market Context: Failing to consider broader market conditions and relying solely on signals from the Bill Williams Indicator may lead to misguided trading decisions.
- Ignoring Confirmation Signals: Disregarding confirmation signals from other technical indicators or price action patterns may result in entering trades prematurely or missing profitable opportunities.
- Neglecting Risk Management: Overlooking risk management principles, such as setting stop-loss orders and managing position sizes, can expose traders to excessive risk and potential losses.
By avoiding these common mistakes and adhering to sound trading principles, traders can maximize the effectiveness of the Bill Williams Indicator and enhance their trading performance.
Resources for further learning about the Bill Williams Indicator
For traders interested in delving deeper into the Bill.
Conclusion
In conclusion, mastering the interpretation of signals generated by the Bill Williams Indicator is essential for traders aiming to navigate the financial markets successfully. By understanding the principles underlying this powerful technical analysis tool and effectively interpreting its signals, traders can make informed decisions that align with prevailing market trends and momentum.
The Bill Williams Indicator offers traders valuable insights into market dynamics, trend confirmation, potential reversals, and momentum shifts. Through careful observation of the convergence and divergence of its components, particularly the Alligator Indicator lines, traders can identify opportune moments to enter or exit trades with confidence.
Trend confirmation signals, signaled by aligned and diverging Alligator Indicator lines, provide traders with a clear indication of prevailing market direction. Conversely, crossovers or convergences of the Alligator lines serve as potential indicators of trend reversals, prompting traders to adjust their positions accordingly.
Additionally, the Awesome Oscillator component of the Bill Williams Indicator offers valuable insights into market momentum, allowing traders to gauge the strength and sustainability of trends.
By combining these signals and integrating them with other technical analysis tools and market fundamentals, traders can develop robust trading strategies that capitalize on market opportunities while minimizing risks.
In the ever-changing landscape of the financial markets, proficiency in interpreting the signals of the Bill Williams Indicator empowers traders to navigate volatility, identify high-probability trading setups, and achieve consistent profitability over time. Through continuous learning, practice, and refinement, traders can harness the full potential of this versatile indicator and elevate their trading performance to new heights.
Read our latest article on Forex Scalping
FAQs
- What is the Bill Williams Indicator, and how does it work?
- The Bill Williams Indicator is a technical analysis tool developed by trader Bill Williams, incorporating various components like the Alligator Indicator, Fractals, and the Awesome Oscillator. It helps traders identify market trends, potential reversals, and momentum shifts.
- What principles underlie the Bill Williams Indicator?
- The Bill Williams Indicator is based on principles such as market psychology, chaos theory, fractals, and momentum analysis. These principles help traders interpret market dynamics and make informed trading decisions.
- How does the Alligator Indicator within the Bill Williams Indicator function?
- The Alligator Indicator consists of three moving averages (Jaw, Teeth, and Lips), representing different timeframes. When these lines align and diverge, it confirms a trend. Crossovers or convergences indicate potential trend reversals.
- What role do Fractals play in the Bill Williams Indicator?
- Fractals help identify key support and resistance levels by highlighting patterns of price reversal. They assist traders in spotting potential turning points in the market.
- What is the significance of the Awesome Oscillator in the Bill Williams Indicator?
- The Awesome Oscillator measures the momentum of price movements by comparing two simple moving averages. Positive values indicate bullish momentum, while negative values suggest bearish momentum, aiding traders in confirming trends and potential reversals.
- How can traders interpret signals from the Bill Williams Indicator?
- Traders interpret signals from the Bill Williams Indicator by analyzing the convergence and divergence of its components. They look for trend confirmations, trend reversals, and momentum confirmations to make trading decisions.
- What are some key signals provided by the Bill Williams Indicator?
- Key signals include confirmation of trends when Alligator Indicator lines align and diverge, indications of trend reversals through crossovers or convergences, and confirmation of momentum shifts with the Awesome Oscillator.
- How can traders effectively utilize the Bill Williams Indicator in their trading strategies?
- Traders can incorporate the Bill Williams Indicator into their strategies by using it to identify trends, confirm reversals, and gauge momentum. It can be combined with other technical analysis tools for comprehensive market analysis.
- What are common mistakes to avoid when using the Bill Williams Indicator?
- Common mistakes include overlooking market context, ignoring confirmation signals, and neglecting risk management. Traders should also avoid relying solely on the indicator without considering broader market factors.
- Where can traders find further resources to learn about the Bill Williams Indicator?
- Traders can find further resources through books, online courses, and trading communities dedicated to technical analysis. Additionally, practice and hands-on experience are invaluable for mastering the application of the Bill Williams Indicator in trading.
Click here to read more on Alligator Indicator