
Unlocking the Power of Harmonic Trading Patterns in Forex Trading
In the fast-paced world of forex trading, traders are always on the lookout for reliable indicators and patterns to gain an edge in the market. Among the multitude of trading strategies available, harmonic patterns have emerged as a powerful tool for identifying potential trend reversals with high accuracy.
In this comprehensive guide, we’ll delve into what harmonic patterns are, the types of harmonic patterns, how to identify them, trading strategies, risk management techniques, real-life examples, and how you can incorporate them into your trading arsenal.
Understanding Harmonic Patterns
Harmonic patterns are geometric price formations that adhere to specific Fibonacci ratios. These patterns signify potential reversal points in the market, offering traders opportunities to enter or exit positions profitably. The most common harmonic patterns include the Gartley, Butterfly, Bat, and Crab patterns. Each pattern has distinct characteristics based on the positioning of swing highs and lows within the price structure.
- Gartley Pattern: Named after H.M. Gartley, this pattern consists of four distinct price swings, forming an M or W shape. It typically indicates a potential reversal near a key Fibonacci retracement level.
- Butterfly Pattern: The Butterfly pattern resembles a butterfly with its wings. It consists of five points and is characterized by precise Fibonacci ratios between its various swings.
- Bat Pattern: The Bat pattern is similar to the Gartley pattern but has more stringent Fibonacci ratios between its swings. It often signals trend reversals with high accuracy.
- Crab Pattern: The Crab pattern is one of the most precise harmonic patterns, featuring extreme Fibonacci ratios. It indicates potential reversals in the market with significant price retracements.
Identifying Harmonic Patterns in Forex Charts
Identifying harmonic patterns in forex charts is a skill that combines technical analysis with an understanding of Fibonacci ratios. While some traders rely on specialized tools or software for automated pattern recognition, manual identification involves a systematic approach. Here’s an expanded guide on how to identify harmonic patterns manually:
1. Identify Swing Points:
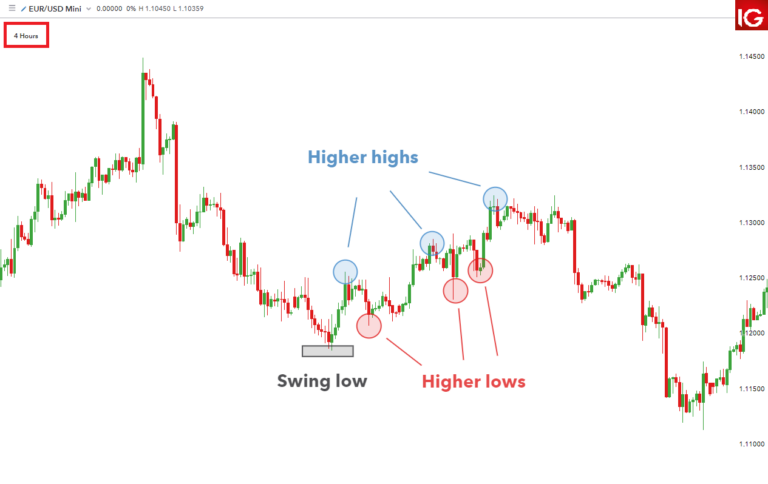
Swing points are pivotal junctures in price action, representing significant highs and lows in the market. Traders must identify these swing points accurately to recognize potential harmonic patterns. A swing high occurs when the price peaks and starts to decline, while a swing low forms when the price bottoms out before rising again. By pinpointing these swing points, traders establish the foundation for identifying harmonic patterns.
2. Measure Price Swings:
Once swing points are identified, the next step is to measure the magnitude of price swings. Fibonacci retracement and extension tools are instrumental in this process. Traders draw these tools from the starting point of a swing to its endpoint, encompassing the entire price movement. The Fibonacci levels derived from these tools provide critical reference points for assessing the relationship between price swings and Fibonacci ratios.
3. Confirm Fibonacci Ratios:
Fibonacci ratios serve as the backbone of harmonic pattern analysis. Traders assess whether price swings adhere to specific Fibonacci ratios, such as 0.618, 0.786, 1.272, and 1.618. These ratios represent key levels of support and resistance within the market structure. By comparing the length of price swings to these ratios, traders gauge the harmonic nature of the pattern. The closer the alignment between price swings and Fibonacci ratios, the stronger the indication of a harmonic pattern.
4. Validate Pattern Structure:
Validation of pattern structure is essential to ensure the pattern conforms to the characteristics of the chosen harmonic pattern. Each harmonic pattern has distinct structural requirements that must be met for validation. For example, the Gartley pattern requires specific ratios between price swings, while the Butterfly pattern necessitates precise alignment of swing points. Traders scrutinize the arrangement of swing highs and lows to confirm whether the pattern exhibits the anticipated structure.
5. Additional Considerations:
Beyond the basic steps outlined above, traders may incorporate additional criteria for pattern identification. This could involve assessing the symmetry of the pattern, considering the presence of internal ratios within the pattern, or evaluating the overall context of the market. Traders may also look for supplementary confirmation signals, such as candlestick patterns or oscillators, to bolster their analysis.
Identifying harmonic patterns in forex charts is a meticulous process that requires a combination of technical skill and pattern recognition. By following a systematic approach that involves identifying swing points, measuring price swings, confirming Fibonacci ratios, and validating pattern structure, traders can effectively spot potential harmonic patterns within the market.
While manual identification may require time and practice to master, it provides traders with a deeper understanding of market dynamics and enhances their ability to capitalize on trading opportunities.
Fibonacci Retracement and Extension Levels in Harmonic Patterns
Fibonacci Retracement Levels:
Fibonacci retracement levels are essential tools for identifying potential support or resistance areas within a price trend. These levels are calculated by taking the Fibonacci ratios of a significant price movement, typically from a swing low to a swing high in an uptrend or vice versa in a downtrend. Traders use Fibonacci retracement levels to anticipate where price corrections may occur before the trend resumes. The most common retracement levels used in harmonic patterns are:
- 0.382 (38.2%): This level represents the first significant retracement level and is often considered a shallow retracement within the overall trend.
- 0.618 (61.8%): Also known as the “golden ratio,” this level is widely regarded as one of the most significant retracement levels. Price often retraces to this level before continuing in the direction of the trend.
- 1.000 (100%): While not a traditional Fibonacci retracement level, the 1.000 level represents a complete retracement of the initial price movement, indicating a potential trend reversal or consolidation phase.
Fibonacci Extension Levels:
Fibonacci extension levels are projections beyond the initial price movement and are used to identify potential price targets or reversal zones. These levels are derived from the same Fibonacci ratios but are applied differently. In harmonic patterns, Fibonacci extension levels are crucial for determining where price may reverse or extend beyond the initial pattern formation. The most common extension levels used in harmonic patterns are:
- 1.272 (127.2%): This extension level often acts as the initial target for price after completing a harmonic pattern. Traders may consider taking partial profits or adjusting stop-loss orders at this level.
- 1.618 (161.8%): Known as the “golden extension ratio,” this level is considered a primary target for price extensions in harmonic patterns. It signifies a significant potential reversal zone or continuation point.
- 2.000 (200%): While less common, the 2.000 extension level represents a potential area of extreme price extension. Traders may use this level as a secondary target or to identify overextended price moves.
Application in Harmonic Patterns:
In harmonic patterns, Fibonacci retracement and extension levels provide key insights into pattern formation and potential reversal zones. Traders use these levels to validate the structure of harmonic patterns and determine entry, exit, and target levels. For example, in a bullish Gartley pattern, traders may look for the D point to align closely with Fibonacci retracement levels such as 0.618 or 0.786, indicating a high-probability reversal zone. Similarly, traders may use Fibonacci extension levels to project potential price targets for the completion of the pattern.
Fibonacci retracement and extension levels are integral components of harmonic pattern analysis, providing traders with valuable tools for identifying potential reversal zones and projecting price targets. By understanding how these Fibonacci ratios are applied within harmonic patterns, traders can enhance their analysis and make more informed trading decisions.
Whether used independently or in conjunction with other technical indicators, Fibonacci retracement and extension levels remain essential for traders seeking to capitalize on harmonic patterns and navigate the dynamic forex markets with confidence.
Rate price reversals and plan their entry and exit points accordingly.
Trading Strategies Using Harmonic Patterns
Trading harmonic patterns involves a combination of pattern recognition, Fibonacci analysis, and strategic entry and exit points. Here are some popular trading strategies used by traders:
- Pattern Completion Strategy: Enter trades once the harmonic pattern completes, usually at the D point, with confirmation from other technical indicators such as oscillators or candlestick patterns.
- Confluence of Factors: Look for confluence zones where multiple Fibonacci levels, trendlines, or support/resistance levels align with the completion point of a harmonic pattern, increasing the probability of a successful trade.
- Risk-Reward Ratio: Maintain a favorable risk-reward ratio for each trade, aiming for higher reward potential while limiting risk through tight stop-loss orders.
Risk Management and Stop Loss Placement with Harmonic Patterns
Risk management is a cornerstone of successful trading, and when it comes to trading harmonic patterns, it becomes even more crucial. Here’s an expanded guide on risk management techniques and stop-loss placement tailored specifically for harmonic pattern trading:
1. Set Stop Loss Orders:
Stop-loss orders are essential tools for managing risk and limiting potential losses. When trading harmonic patterns, it’s crucial to place stop-loss orders at strategic levels to protect against adverse market movements. Traders typically place stop-loss orders below/above the completion point of the harmonic pattern, depending on whether it’s a bullish or bearish pattern. By placing stop-loss orders at these levels, traders aim to exit the trade promptly if the price moves against their expectations, thereby minimizing potential losses.
2. Position Sizing:
Position sizing is a critical aspect of risk management that determines the amount of capital allocated to each trade. When trading harmonic patterns, it’s essential to determine the appropriate position size based on the distance between the entry and stop-loss levels. Traders should calculate the position size in a way that aligns with their risk tolerance and overall trading strategy.
Generally, traders may risk a certain percentage of their trading capital per trade, ensuring that potential losses are kept within acceptable limits. By sizing positions appropriately, traders can effectively manage risk and protect their capital while trading harmonic patterns.
3. Trailing Stops:
Trailing stops are dynamic stop-loss orders that adjust automatically as the price moves in the trader’s favor. When trading harmonic patterns, trailing stops can be particularly useful for locking in profits and protecting against sudden reversals. Once the trade moves in the trader’s favor and reaches a predefined profit level, the stop-loss order can be adjusted to trail the price at a specified distance below/above the current market price. This allows traders to capture profits while still giving the trade room to maneuver, thereby maximizing potential gains while minimizing the risk of giving back profits in the event of a reversal.
4. Additional Considerations:
In addition to the above risk management techniques, traders may also consider implementing other risk mitigation strategies when trading harmonic patterns. This could include diversifying trading portfolios across different instruments or asset classes, avoiding overleveraging, and maintaining a disciplined approach to trading. Furthermore, traders should continuously monitor their trades and adjust their risk management strategies as market conditions evolve.
Effective risk management is paramount when trading harmonic patterns, as it helps preserve capital and minimize losses in the face of market uncertainties. By implementing stop-loss orders, sizing positions appropriately, and using trailing stops, traders can effectively manage risk while capitalizing on trading opportunities presented by harmonic patterns.
However, it’s essential to remember that risk management is an ongoing process that requires constant monitoring and adjustment to adapt to changing market conditions. By prioritizing risk management and adhering to sound trading principles, traders can enhance their chances of long-term success in trading harmonic patterns.
Real-life Examples of Successful Forex Trades Using Harmonic Patterns
To illustrate the effectiveness of harmonic patterns in forex trading, let’s consider a real-life example:
Suppose you identify a bullish Gartley pattern on the EUR/USD daily chart, with the D point coinciding with the 0.786 Fibonacci retracement level and a previous support/resistance zone. You enter a long position at the completion point with a stop-loss order placed below the X point. The trade subsequently rallies, hitting your predetermined profit target, resulting in a profitable trade.
How to Start Incorporating Harmonic Patterns into Your Trading Strategy
If you’re new to harmonic patterns, here’s a step-by-step guide to incorporating them into your trading strategy:
- Educate Yourself: Learn about the different types of harmonic patterns, their characteristics, and how to identify them accurately.
- Practice: Use demo accounts or historical data to practice identifying harmonic patterns and executing trades without risking real money.
- Develop a Trading Plan: Define clear entry and exit criteria, risk management rules, and position sizing strategies tailored to harmonic pattern trading.
- Backtest Your Strategy: Test your trading plan on historical data to assess its performance and refine it as needed.
- Stay Disciplined: Stick to your trading plan and avoid emotional decision-making, even in the face of temporary setbacks.
Conclusion
In conclusion, harmonic patterns present forex traders with a systematic and structured method for identifying potential trend reversals with remarkable precision. Through the application of Fibonacci ratios and pattern recognition techniques, traders can leverage these formations to elevate their trading performance and capitalize on lucrative opportunities in the forex market.
The foundation of harmonic pattern trading lies in understanding the underlying principles of Fibonacci ratios and their significance in market dynamics. By recognizing the inherent relationships between price movements and Fibonacci levels, traders can identify harmonic patterns with greater accuracy, enabling them to enter trades with confidence and precision.
However, achieving success with harmonic patterns necessitates more than just technical knowledge. It demands discipline, patience, and rigorous risk management. Traders must exercise diligence in adhering to their trading plans, patiently waiting for the right setups, and implementing effective risk management strategies to safeguard their capital.
Incorporating harmonic patterns into one’s trading arsenal is not a guarantee of immediate success. It requires dedication and practice to master the nuances of pattern identification and execution. Traders must invest time and effort into honing their skills and refining their approach to harmonic pattern trading.
Ultimately, by embracing harmonic patterns and mastering their application, traders can gain a significant edge in the forex market. With a comprehensive understanding of these formations and a disciplined approach to trading, traders can navigate the complexities of the market with confidence and consistency, ultimately achieving long-term profitability and success.
Read our latest article on Forex vs Stocks
FAQs
FAQs about Harmonic Patterns in Forex Trading
- What are harmonic patterns in forex trading?Harmonic patterns are geometric price formations that indicate potential trend reversals in the forex market. These patterns adhere to specific Fibonacci ratios and offer traders opportunities to enter or exit positions profitably.
- What are the common types of harmonic patterns?The common types of harmonic patterns include the Gartley, Butterfly, Bat, and Crab patterns. Each pattern has distinct characteristics based on the positioning of swing highs and lows within the price structure.
- How can I identify harmonic patterns in forex charts?Harmonic patterns can be identified manually by looking for significant swing highs and lows, measuring price swings using Fibonacci retracement and extension tools, confirming adherence to Fibonacci ratios, and validating pattern structure.
- What role do Fibonacci retracement and extension levels play in harmonic patterns?Fibonacci retracement and extension levels act as key support and resistance areas, helping traders identify potential reversal zones and price targets within harmonic patterns.
- What trading strategies can I use with harmonic patterns?Trading strategies with harmonic patterns include pattern completion strategy, confluence of factors, and consideration of risk-reward ratio to enter and exit trades profitably.
- How should I manage risk when trading harmonic patterns?Effective risk management involves setting stop-loss orders below/above the completion point of the pattern, sizing positions appropriately based on risk tolerance, and using trailing stops to protect profits.
- Can you provide real-life examples of successful trades using harmonic patterns?Yes, for instance, a trader identifying a bullish Gartley pattern on the EUR/USD daily chart and entering a long position at the completion point could achieve a profitable trade if the pattern aligns with other technical indicators and market conditions.
- How can I start incorporating harmonic patterns into my trading strategy?To incorporate harmonic patterns into your trading strategy, educate yourself about different patterns, practice pattern recognition, develop a trading plan, backtest your strategy, and stay disciplined in your approach.
- Are there any limitations or risks associated with trading harmonic patterns?Like any trading strategy, trading harmonic patterns carries inherent risks, including the potential for false signals, market volatility, and unexpected price movements. It’s essential to exercise caution and implement proper risk management techniques.
- What are the long-term benefits of mastering harmonic pattern trading?Mastering harmonic pattern trading can provide traders with a competitive edge in the forex market, leading to consistent profitability over time. By combining technical analysis skills with disciplined execution, traders can achieve sustainable success in their trading endeavors.
Click here to read more on Harmonic Trading